The right approach is based on the critical element of understanding how people use information to solve problems and gauge performance. There is a clear need to provide effective and relevant information necessary to support the information consumed by the different roles in the manufacturing operations. Identifying what needs to be measured is a fundamental principle but it is not sufficient, the information also has to be arranged in a usable manner. Therefore it is important to study and understand information consumption patterns by roles. Take for example the information consumption pattern for a supervisor in a biotech plant that is creatively analyzing a production event.
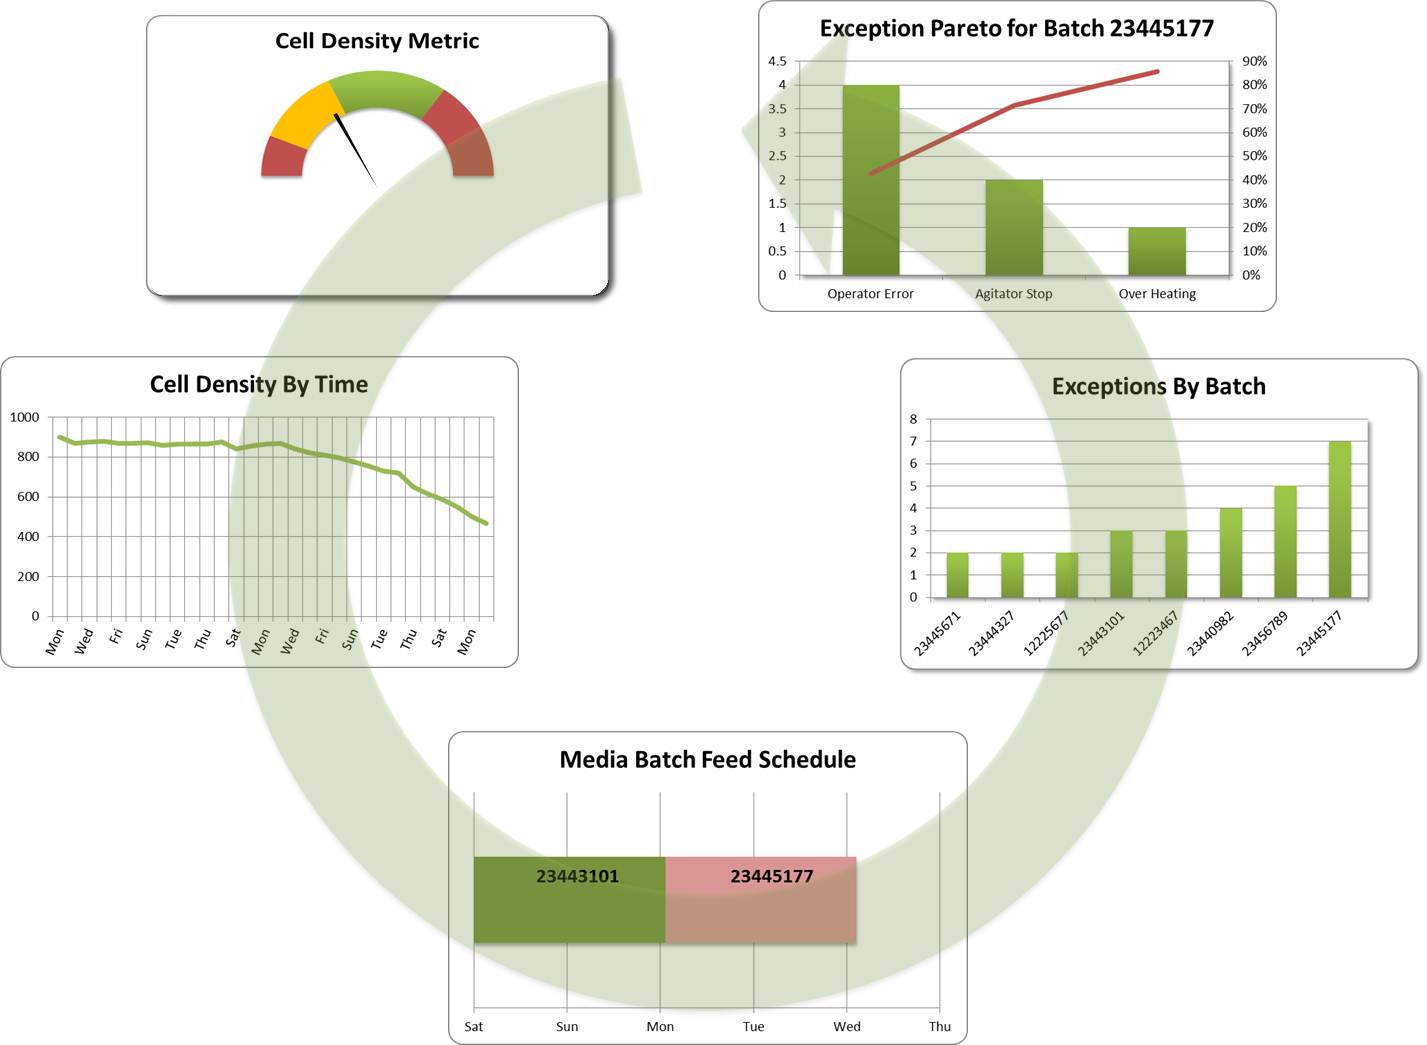
The production supervisor glances at his dashboard and observes that the Cell Density is not within acceptable limits. He immediately navigates to view the “Cell Density by Time” trend over the last 2 weeks and observes a negative trend beginning around “Mon.” that indicates something is seriously not in order.
To begin the analysis, he examines the “Media Batch Feed Schedule” to see if there is any correlation between the trend and the Media that is being fed to the bio-reactor. This action is obviously based on intuition possibly because he has seen that before. Seeing that there is a correlation between the change to a new Media batch feed when the trend start he decides to take a look at the “Exception By Batch” information and notices that this specific batch had an unusual number of exceptions. He then dives deeper into the data by analyzing an exception Pareto for the suspect batch. He finds a high number of operator errors, which clearly highlights the root cause of the trend. Finally since he is accountable for operational profits he decides to take a look at the cost impact of this event in order to understand what the impact is to the plants financial performance (see graphic below). Unfortunately the cost impact is substantial and thus he as to take action to mitigate this increased cost.

The scenario shows the power of “Actionable Intelligence”.
The supervisor has all the information he needs in order to quickly and
effectively analyze the situation to determine root-cause and he can take
action based on the results. The path that the supervisor decides to take
in the example above is one of several that could have been used to detect and
diagnose the Cell Density performance issue. It is this type of self-guided or
self-serve analysis that really shows how information is consumed to meet a
specific goal and should be the common pattern for the information required by
a specific person or role. These requirements have direct bearing on the
information context and data structures that must be provided, and the
dimensions by which the metric is analyzed or “sliced and diced”. Although this
seems trivial at first the requirements that this analysis patterns has on the
underlying information and data structures is significant and is a critical
component of the system design. It is not enough just to collect the data; it
has to be arranged in a manner that enables this unique type of analytic
information consumption.
4 comments:
This article structure based on the crucial factor of knowing how people use details to resolve the problems and evaluate performance. There is a clear need to provide effective and appropriate details necessary to back up the details absorbed by the different tasks in the production functions. The second graph shows the power of Actionable Intelligence. The situation reveals the power of “Actionable Intelligence”. The manager has all the details he needs in order to quickly evaluate the situation to figure out root-cause and he can take action depending on the results. Market Reseacrh Report
Hey guys superb article
website development company in bangalore
It's Very informative blog and useful article thank you for sharing with us , keep
posting learn more about BI Tools
Tableau Online Training
I am happy for sharing on this blog its awesome blog I really impressed. thanks for sharing. Great efforts.
Web Designing Training in Chennai
Web Designing Course in Chennai
Web Designing Training in Bangalore
Web Designing Course in Bangalore
Web Designing Training in Hyderabad
Web Designing Course in Hyderabad
Web Designing Training in Coimbatore
Web Designing Training
Web Designing Online Training
Post a Comment